
Gold has been one of the defining asset stories of the past 18 months. From its breakout above $2,500 in late 2024 to its historic surge past $3,000 in early 2026, the yellow metal has rewarded bulls consistently — but the picture is now considerably more complicated.
Three forces converge this week that make the next five trading sessions pivotal for gold's Q3 direction:
Markets currently price a 68% probability of a September rate cut. Any internal Fed dissent revealed in the minutes could revise that consensus sharply — and with it, gold's entire fundamental thesis for the remainder of 2026.
Even a minor upside inflation surprise pushes the dollar higher and applies direct downward pressure on gold. The level to watch is 3.0% YoY — anything above that constitutes a material bearish catalyst for the week.
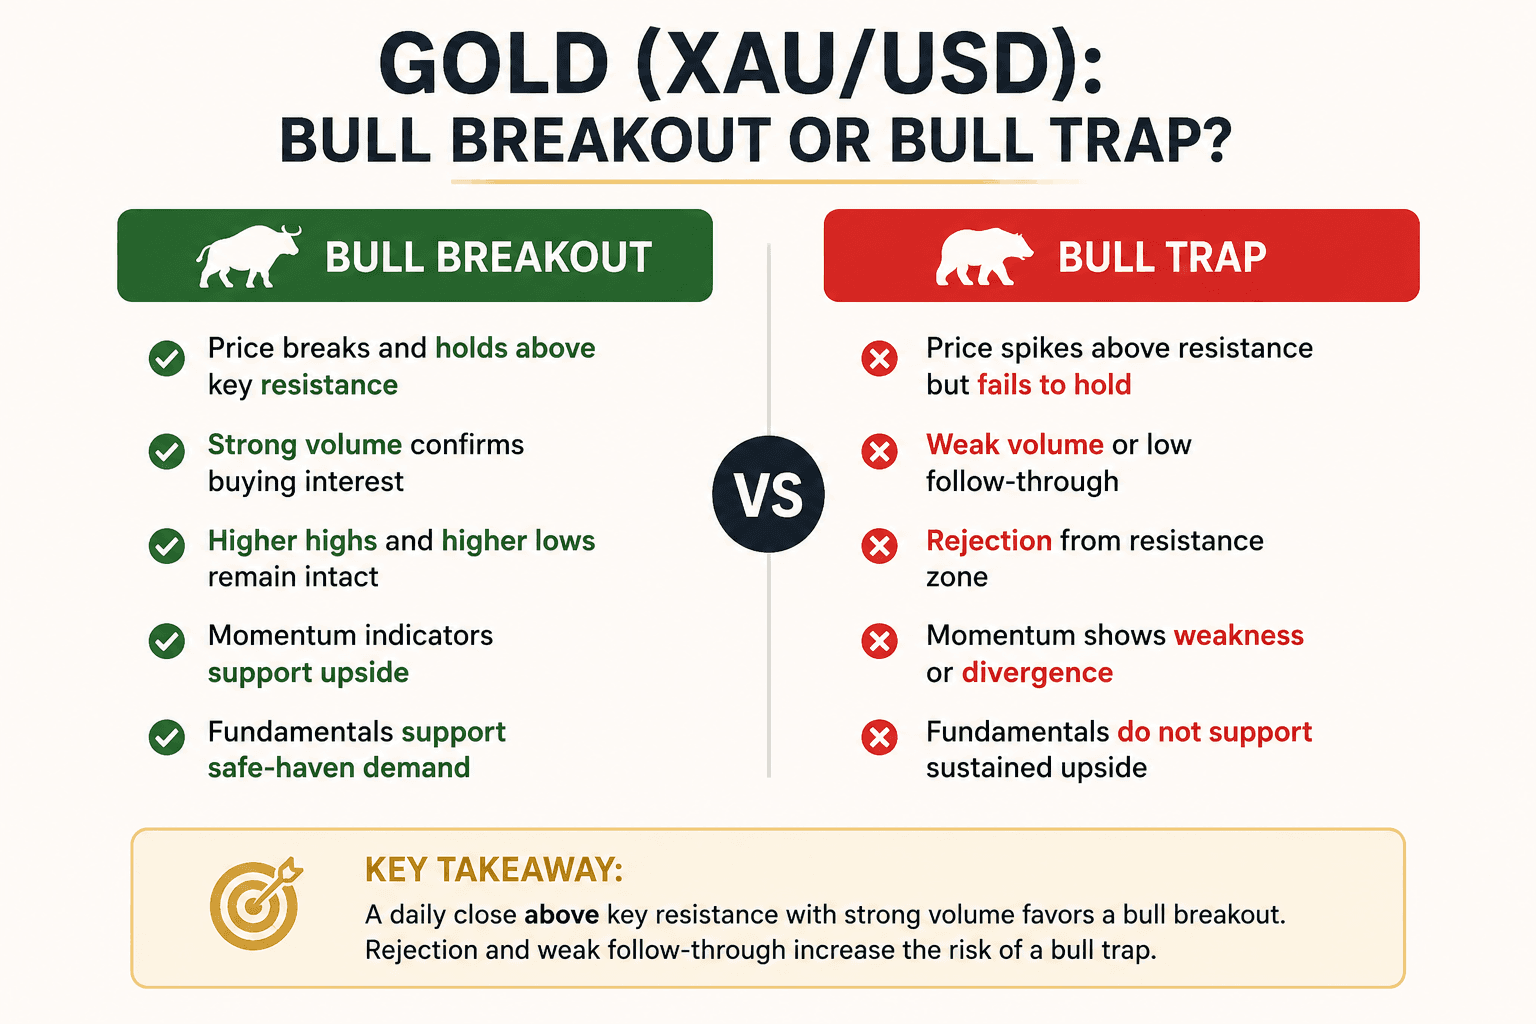
A symmetrical triangle on the daily chart converges around June 20–23. These patterns resolve in the direction of the prevailing trend roughly 60% of the time — upward here. But the week's macro data will be the deciding factor, and false breakouts are common ahead of major catalysts.
Most critically: gold is holding above $3,200 by a margin of less than 0.5%. That level has acted as both support and resistance for six consecutive weeks. A confirmed break below it — or a decisive close above $3,260 — will set the directional tone for all of Q3.
The pattern is unmistakable: $3,200 is the magnet. Every significant deviation over the past six weeks has been corrected within days. This kind of coiling price action ahead of a major catalyst week typically precedes a significant directional move — the compression cannot last indefinitely.
A symmetrical triangle has formed between declining resistance from $3,310 and rising support from $3,140. The apex converges around June 20–23. These patterns resolve in the prevailing trend's direction roughly 60% of the time — upward in this case. The measured move targets $3,380 to the upside or $3,040 to the downside.
The bull case for gold in 2026 rests on four structural pillars that have not materially changed:
Data through Q1 2026 shows central banks globally adding approximately 290 tonnes net — consistent with the record pace of 2024–2025. Primary buyers are China, India, Turkey, and Poland, all actively reducing US dollar reserve exposure.
The US 10-year real yield sits at +0.82% — theoretically gold-negative. But gold's resilience above $3,200 despite positive real yields signals the market is already pricing in a rate-cut trajectory that will push real yields back toward zero or negative territory.
The DXY is at 102.4, down from its 2026 high of 105.8. A continued drift toward 100 would provide meaningful tailwind. The structural dollar headwinds of twin-deficit expansion and a Fed easing trajectory remain intact.
Acute geopolitical tensions from 2025 have partially normalised, but structural uncertainty around US-China trade relations, Middle East dynamics, and European political fragmentation continues to underpin baseline safe-haven demand.
If US data proves more resilient than expected and the Fed delays rate cuts beyond Q4 2026, gold could face a meaningful correction — potentially back to the $3,000–$3,050 range, where the 100-day MA and psychological support converge. A DXY recovery toward 105 would accelerate that scenario rapidly.
CFTC Commitments of Traders — Gold Futures · As of June 10, 2026
The pullback in managed money net longs from April highs reflects profit-taking and position normalisation — not a structural bearish shift. The substantial commercial hedger net short position tells us mining companies are locking in prices at current levels: a mild contrarian signal that $3,200+ represents fair-to-high value in the near term.
CPI ≤2.7% YoY + FOMC confirms Sept cut
Daily close above $3,260
$3,310 (all-time high retest)
$3,350 (Fibonacci extension)
$3,195
1:2.8 (to Target 1)
Mixed/in-line macro data; no strong catalyst
Buy zone $3,170–$3,185
$3,240–$3,250 (range ceiling)
$3,145 (below triangle support)
1:2.2
CPI above 3.0% YoY; DXY breaks 104
Daily close below $3,168
$3,140 (50-day MA)
$3,095 (100-day MA)
$3,210
1:2.1 (to Target 2)
The weight of technical evidence, macro fundamentals, and institutional positioning leans mildly bullish — but this is a week where the wrong data print could rapidly change the calculus. The symmetrical triangle compression converging with three major macro catalysts in four trading days makes this a high-probability setup for a significant move in either direction.
The directional bias is upward: central bank buying hasn't slowed, real yields are trending toward rate-cut territory, and the dollar faces structural headwinds. The disciplined approach is to wait for a confirmed daily close above $3,260 before committing aggressively to the long side. But the downside scenario demands equal respect — a break below $3,168 would be technically significant and could accelerate toward $3,095 quickly on a hot CPI print.